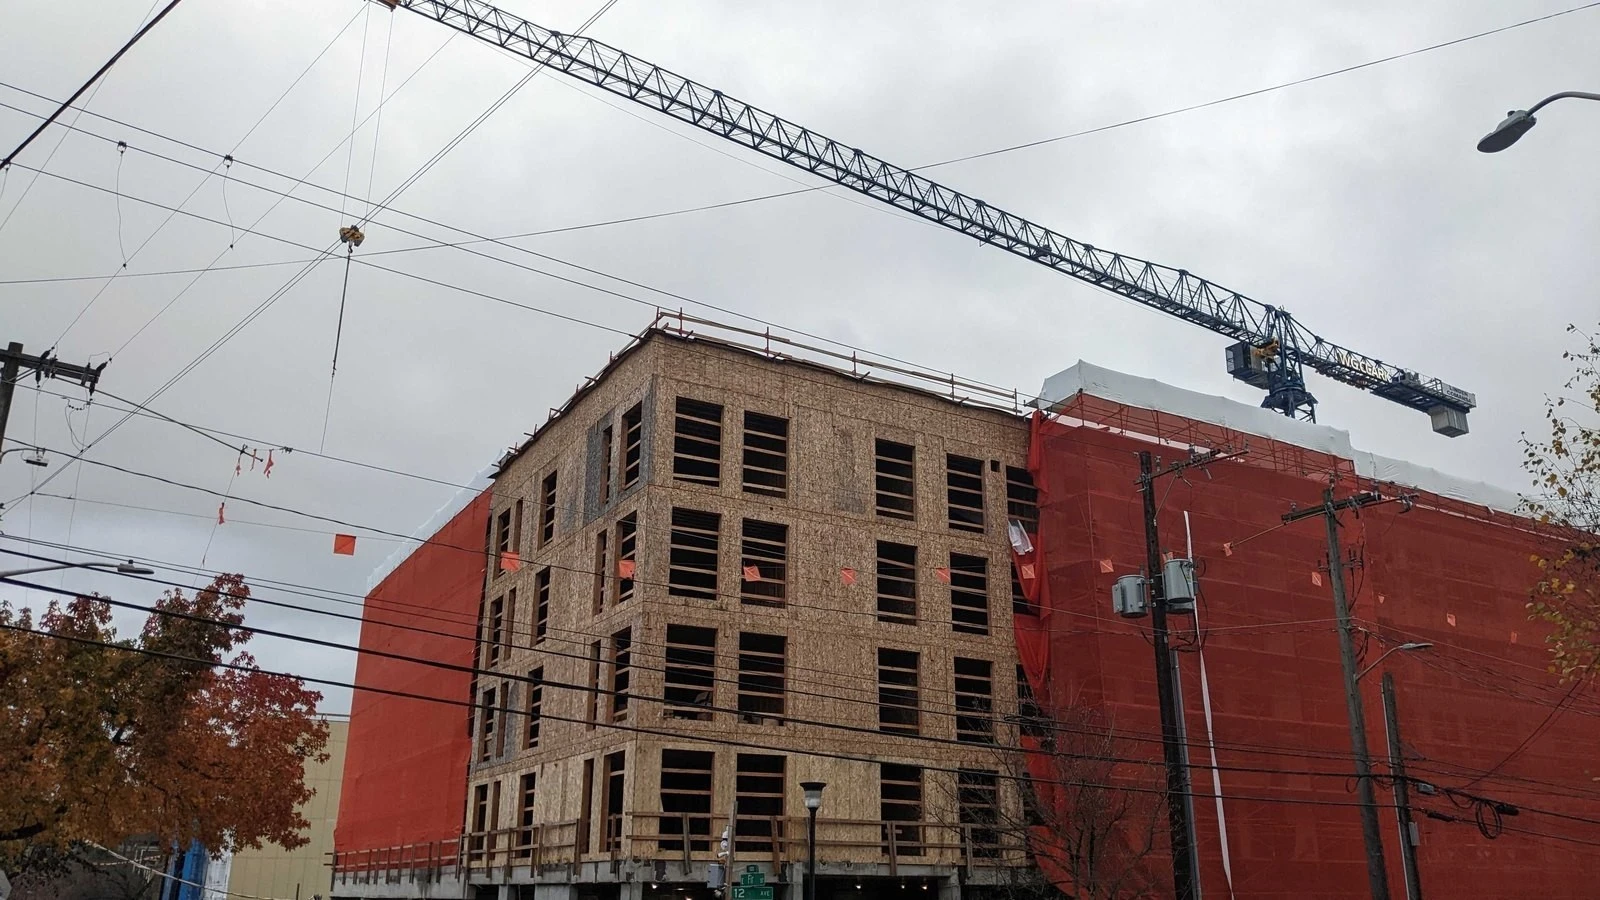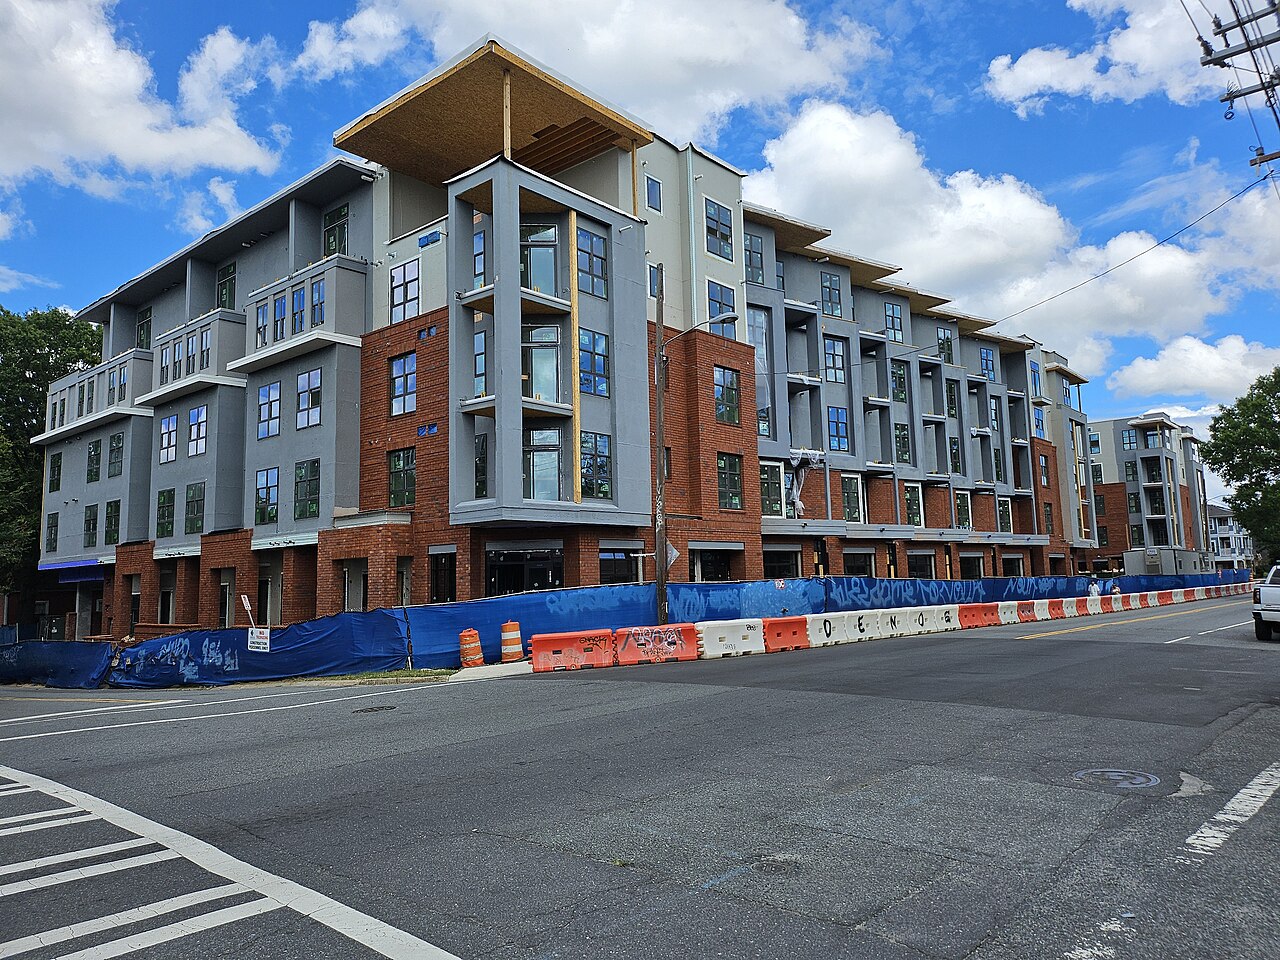
For a Charlotte apartment owner weighing a sale—or a buyer evaluating an acquisition—the prospect of fewer new apartments sounds encouraging. Less competition could give existing properties more room to increase rents.
But a slowing construction cycle only tells part of the story. The investment question is how quickly competing properties fill, what they offer to attract residents, and when that pressure eases around a particular asset.
That timing can materially change what a property earns and what a buyer can justify paying.
Slower supply, continued competition
Matthews’ third-quarter 2026 report illustrates the challenge. Across its Charlotte market coverage, apartment completions fell 45% over the preceding twelve months, to 9,284 units. Yet net absorption—the increase in occupied units—totaled 7,441. Vacancy stood at 6.0%, while average rent declined 0.4% year over year. Deliveries slowed, but still exceeded net demand over that period. Matthews, Q3 2026 Charlotte report
Our interpretation: fewer deliveries are an encouraging input. A rent-recovery assumption still needs evidence from the properties competing for the same residents.
Look at the effective price
Consider a garden-style community competing with a newer development nearby. The newer property may advertise a higher monthly rent while offering substantial free rent. That incentive can bring its effective price close enough to attract residents who would otherwise choose the older community.
In a hypothetical example, a $1,800 apartment offering two months free on a twelve-month lease has an effective monthly rent of $1,500, before fees. An existing property asking $1,550 with no concession cannot assess its competitive position from advertised rents alone.
For an owner planning renovations, that distinction matters. The renovated unit may look competitive on paper while competing against a newer apartment at a lower effective price.
The submarket is a starting point
Charlotte’s submarket differences also deserve attention. In the same Matthews report, vacancy ranged from 4.9% in Concord/Kannapolis to 7.2% in Huntersville/Cornelius/Mooresville. Those figures establish useful context, although neither describes every property within those areas. Matthews’ submarket findings
The next layer is the property’s actual competition. Which communities attract the same household? Which floor plans are taking longer to lease? Are incentives widespread, or concentrated in particular unit types?
A property can have strong demand for larger layouts while struggling to lease one-bedroom units. Applying one rent-growth assumption across the entire rent roll can conceal that difference.
Three pieces of property-level evidence
For buyers and investors, we would focus on three pieces of evidence:
- Effective rents at direct competitors. Track concessions, lease terms, and mandatory fees alongside advertised pricing.
- Leasing performance by floor plan. Review signed leases, move-ins, renewals, collections, and the incentives required to achieve them.
- The timing of nearby supply. Separate communities already leasing from construction underway and projects that remain proposed.
Owners considering a sale can use the same information to make a stronger case. Improving occupancy is more persuasive when accompanied by stable collections and declining concessions. A claim that competition will ease becomes more credible when supported by a documented delivery schedule.
Waiting for stronger performance also carries a cost. Additional income must be weighed against carrying costs, necessary improvements, financing obligations, and the possibility that recovery takes longer than expected. A buyer should test that delay; an owner should understand it before deciding to hold.
These discussions begin with underwriting the property and understanding the buyer’s criteria. In Charlotte, that means looking closely at the path from today’s leasing conditions to the earnings a proposed price assumes.
A credible investment case should explain what needs to improve, what evidence supports that improvement, and whether the property still works if it takes longer.
Published by The Basis. Research dates, source references and illustrative assumptions are retained from the original article.