
Thursday, November 5, 2026Commercial real estate news
About The Basis
the basis.

Commercial real estate.
The full picture.

Saved storiesLatest stories
Rates
RATE WATCHDaily benchmarks10-year Treasury4.84%-6 bpAs of Nov 55-year Treasury4.59%-10 bpAs of Nov 5SOFR3.92%-2 bpAs of Nov 5Effective Fed funds3.88%UnchangedAs of Nov 5
STATE MARKET PULSESeptember 2026 · BLS · Monthly
New YorkJobs YoY +0.2%Unemployment 4.3%FloridaJobs YoY +0.6%Unemployment 4.4%TexasJobs YoY +1.1%Unemployment 4.4%CaliforniaJobs YoY +0.7%Unemployment 5.1%New JerseyJobs YoY +0.1%Unemployment 4.2%North CarolinaJobs YoY +1.3%Unemployment 3.4%AlabamaJobs YoY +1.0%Unemployment 3.5%AlaskaJobs YoY +1.2%Unemployment 4.3%ArizonaJobs YoY +0.6%Unemployment 4.9%ArkansasJobs YoY +0.9%Unemployment 3.9%ColoradoJobs YoY +0.4%Unemployment 4.1%ConnecticutJobs YoY +0.9%Unemployment 5.1%DelawareJobs YoY +0.3%Unemployment 4.6%District of ColumbiaJobs YoY -3.5%Unemployment 5.6%GeorgiaJobs YoY 0.0%Unemployment 3.3%HawaiiJobs YoY +0.1%Unemployment 2.8%IdahoJobs YoY +1.0%Unemployment 3.6%IllinoisJobs YoY +0.2%Unemployment 4.6%IndianaJobs YoY -0.4%Unemployment 3.4%IowaJobs YoY +0.3%Unemployment 3.2%KansasJobs YoY +0.3%Unemployment 3.8%KentuckyJobs YoY 0.0%Unemployment 4.7%LouisianaJobs YoY +1.8%Unemployment 4.0%MaineJobs YoY +0.1%Unemployment 3.3%MarylandJobs YoY -0.5%Unemployment 3.9%MassachusettsJobs YoY +0.4%Unemployment 4.3%MichiganJobs YoY 0.0%Unemployment 5.0%MinnesotaJobs YoY +1.2%Unemployment 4.5%MississippiJobs YoY +0.6%Unemployment 3.3%MissouriJobs YoY +1.0%Unemployment 3.6%MontanaJobs YoY -1.0%Unemployment 3.1%NebraskaJobs YoY +0.4%Unemployment 2.9%NevadaJobs YoY +1.6%Unemployment 4.7%New HampshireJobs YoY +0.3%Unemployment 2.6%New MexicoJobs YoY +1.3%Unemployment 4.7%North DakotaJobs YoY +0.2%Unemployment 2.2%OhioJobs YoY +0.3%Unemployment 3.4%OklahomaJobs YoY +0.8%Unemployment 4.2%OregonJobs YoY -0.1%Unemployment 5.0%PennsylvaniaJobs YoY +0.7%Unemployment 3.6%Rhode IslandJobs YoY -0.1%Unemployment 3.6%South CarolinaJobs YoY +2.3%Unemployment 4.0%South DakotaJobs YoY +0.4%Unemployment 2.0%TennesseeJobs YoY +0.8%Unemployment 3.4%UtahJobs YoY +1.5%Unemployment 3.5%VermontJobs YoY -0.1%Unemployment 2.6%VirginiaJobs YoY -0.6%Unemployment 3.6%WashingtonJobs YoY +0.7%Unemployment 4.8%West VirginiaJobs YoY 0.0%Unemployment 4.0%WisconsinJobs YoY +0.4%Unemployment 3.2%WyomingJobs YoY +0.9%Unemployment 3.0%
All states
Industrial Leasing / NEWS

Granite Reports 35% Rent Spreads and Details Houston and Georgia Leasing

Granite details Houston expansion and Georgia leasing alongside its third-quarter industrial property results.

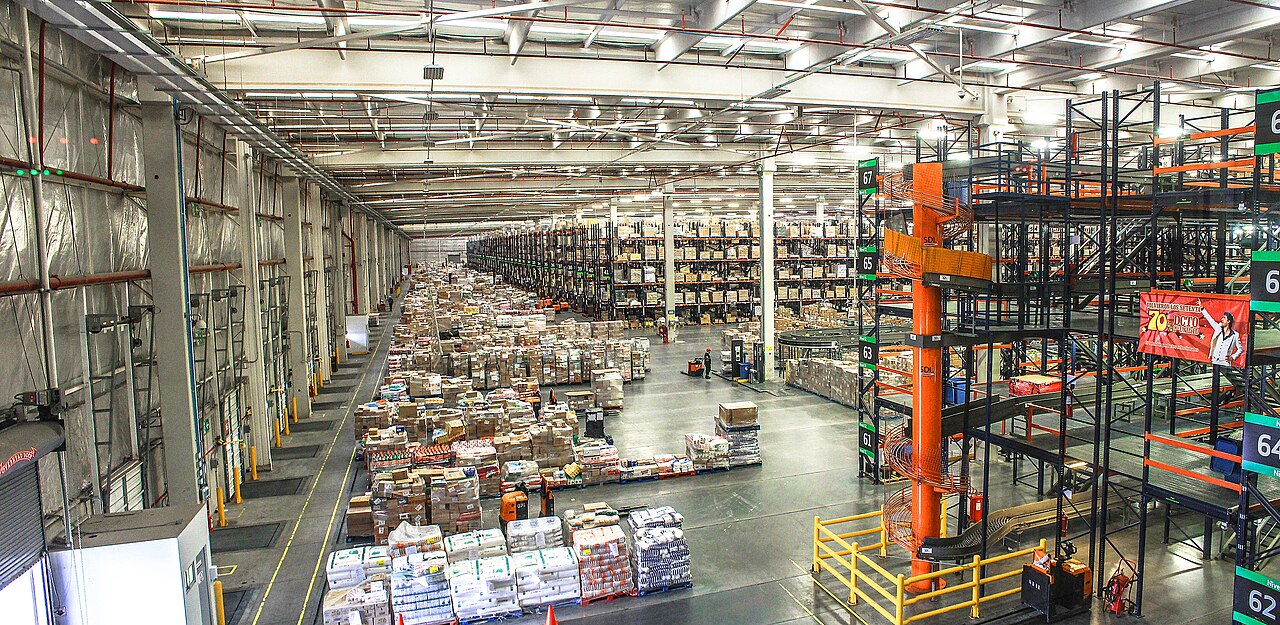
Warehouse interior photographed in January 2016. Archival industrial illustration; not an identified Granite property in Houston or Georgia.
Warehouse interior photographed in January 2016. Archival industrial illustration; not an identified Granite property in Houston or Georgia. Photo: Rsherwin / Wikimedia Commons · CC BY-SA 4.0. Resized by Wikimedia; cropped for display. Adapted photo remains under CC BY-SA 4.0.

Granite REIT’s November 4 results showed 35% average rent spreads on 1.6 million square feet of quarterly leasing, alongside updates on projects in Houston and Locust Grove, Georgia.

The trust reported 96.7% occupancy at September 30, down 130 basis points from June. Granite’s company release distributed by Business Wire

Houston expansion and Georgia tenant transition

Granite said its 400,000-square-foot Houston build-to-suit reached substantial completion, with full completion and occupancy expected this quarter. A 100,000-square-foot expansion is targeted for the second quarter of 2027.

It also reported an 800,000-square-foot replacement lease in Locust Grove, beginning this quarter without vacancy during the transition. These are company disclosures and forecasts. Operating update

What the rent spread does and does not establish

The Basis’s assessment: a large increase on leases taking effect does not mean rents rose 35% across the entire portfolio. The relevant denominator is the space involved in those transactions. Occupancy measures a different exposure: space that is not yet contributing rent. Reading both figures together helps an owner avoid translating strong individual lease economics into an unsupported assumption about portfolio income growth.

The Houston expansion similarly separates contractual demand from delivered space. Its expected 2027 occupancy belongs in future cash-flow assumptions, with construction timing still to be tested.

Related: Houston industrial property context.

Published by The Basis. Research dates, source references and illustrative assumptions are retained from the original article.