
Thursday, November 5, 2026Commercial real estate news
About The Basis
the basis.

Commercial real estate.
The full picture.

Saved storiesLatest stories
Rates
RATE WATCHDaily benchmarks10-year Treasury4.84%-6 bpAs of Nov 55-year Treasury4.59%-10 bpAs of Nov 5SOFR3.92%-2 bpAs of Nov 5Effective Fed funds3.88%UnchangedAs of Nov 5
STATE MARKET PULSESeptember 2026 · BLS · Monthly
New YorkJobs YoY +0.2%Unemployment 4.3%FloridaJobs YoY +0.6%Unemployment 4.4%TexasJobs YoY +1.1%Unemployment 4.4%CaliforniaJobs YoY +0.7%Unemployment 5.1%New JerseyJobs YoY +0.1%Unemployment 4.2%North CarolinaJobs YoY +1.3%Unemployment 3.4%AlabamaJobs YoY +1.0%Unemployment 3.5%AlaskaJobs YoY +1.2%Unemployment 4.3%ArizonaJobs YoY +0.6%Unemployment 4.9%ArkansasJobs YoY +0.9%Unemployment 3.9%ColoradoJobs YoY +0.4%Unemployment 4.1%ConnecticutJobs YoY +0.9%Unemployment 5.1%DelawareJobs YoY +0.3%Unemployment 4.6%District of ColumbiaJobs YoY -3.5%Unemployment 5.6%GeorgiaJobs YoY 0.0%Unemployment 3.3%HawaiiJobs YoY +0.1%Unemployment 2.8%IdahoJobs YoY +1.0%Unemployment 3.6%IllinoisJobs YoY +0.2%Unemployment 4.6%IndianaJobs YoY -0.4%Unemployment 3.4%IowaJobs YoY +0.3%Unemployment 3.2%KansasJobs YoY +0.3%Unemployment 3.8%KentuckyJobs YoY 0.0%Unemployment 4.7%LouisianaJobs YoY +1.8%Unemployment 4.0%MaineJobs YoY +0.1%Unemployment 3.3%MarylandJobs YoY -0.5%Unemployment 3.9%MassachusettsJobs YoY +0.4%Unemployment 4.3%MichiganJobs YoY 0.0%Unemployment 5.0%MinnesotaJobs YoY +1.2%Unemployment 4.5%MississippiJobs YoY +0.6%Unemployment 3.3%MissouriJobs YoY +1.0%Unemployment 3.6%MontanaJobs YoY -1.0%Unemployment 3.1%NebraskaJobs YoY +0.4%Unemployment 2.9%NevadaJobs YoY +1.6%Unemployment 4.7%New HampshireJobs YoY +0.3%Unemployment 2.6%New MexicoJobs YoY +1.3%Unemployment 4.7%North DakotaJobs YoY +0.2%Unemployment 2.2%OhioJobs YoY +0.3%Unemployment 3.4%OklahomaJobs YoY +0.8%Unemployment 4.2%OregonJobs YoY -0.1%Unemployment 5.0%PennsylvaniaJobs YoY +0.7%Unemployment 3.6%Rhode IslandJobs YoY -0.1%Unemployment 3.6%South CarolinaJobs YoY +2.3%Unemployment 4.0%South DakotaJobs YoY +0.4%Unemployment 2.0%TennesseeJobs YoY +0.8%Unemployment 3.4%UtahJobs YoY +1.5%Unemployment 3.5%VermontJobs YoY -0.1%Unemployment 2.6%VirginiaJobs YoY -0.6%Unemployment 3.6%WashingtonJobs YoY +0.7%Unemployment 4.8%West VirginiaJobs YoY 0.0%Unemployment 4.0%WisconsinJobs YoY +0.4%Unemployment 3.2%WyomingJobs YoY +0.9%Unemployment 3.0%
All states
Data Center Leasing / NEWS

Iron Mountain Signs 102 MW of Data Center Leases as Virginia Delivery Dates Come Into Focus

Iron Mountain reports 102 MW of quarterly data center leasing. Its filings separate signed capacity from rent starts and outline Virginia delivery targets.

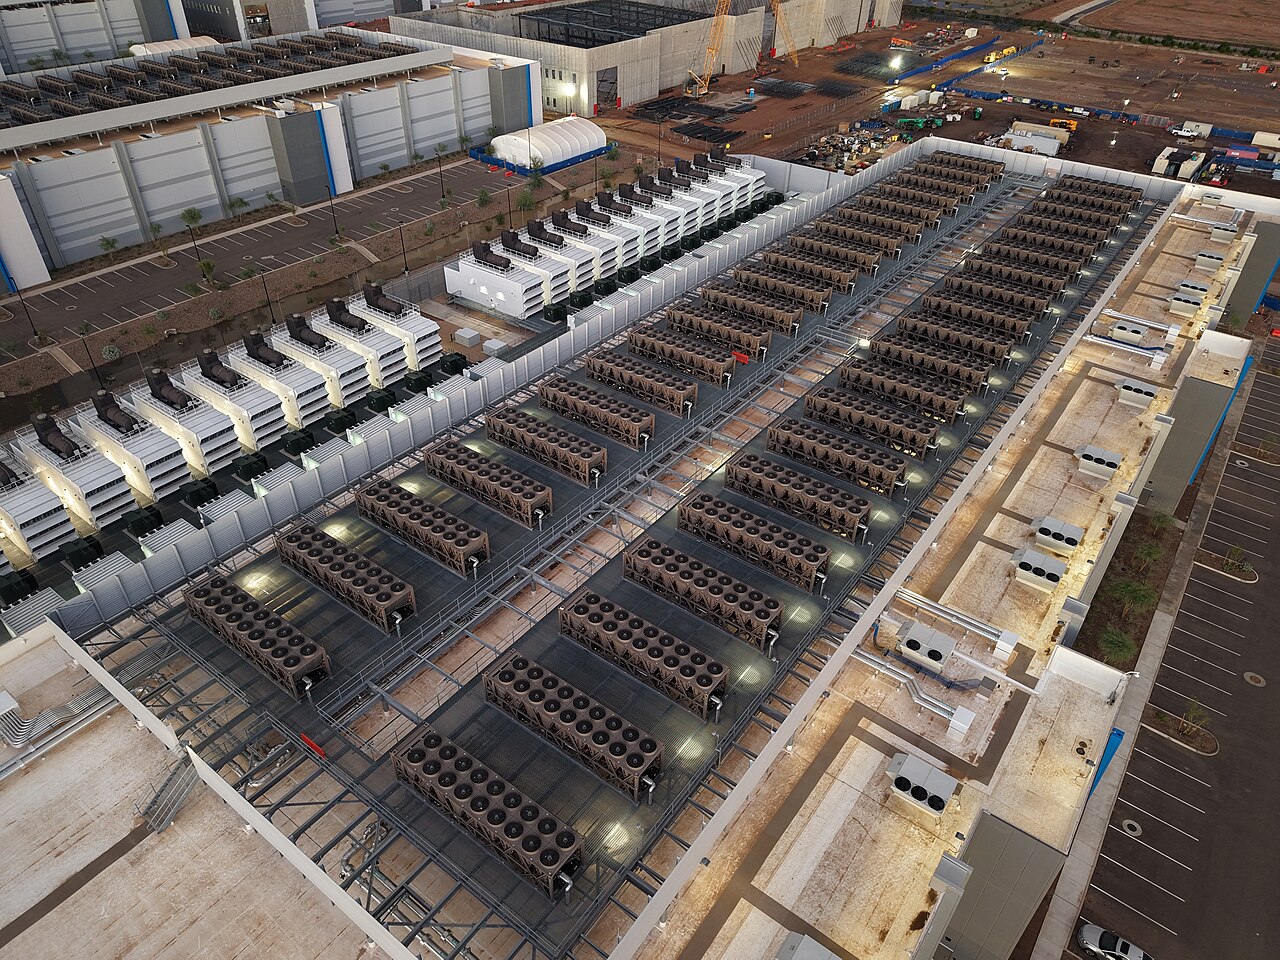
Data centers and commercial buildings near Ashburn, Virginia, in November 2025. Archival regional illustration; not an identified Iron Mountain property.
Data centers and commercial buildings near Ashburn, Virginia, in November 2025. Archival regional illustration; not an identified Iron Mountain property. Photo: Theodore Christopher / Wikimedia Commons / CC0 1.0. Resized by Wikimedia; cropped for display.

Iron Mountain signed about 102 megawatts of data-center leases in the third quarter, bringing its nine-month total to 137 megawatts, the company disclosed in its November 5 earnings release. The results add evidence of contracted demand while leaving a separate question for property investors: when that capacity starts producing rent.

Companywide revenue reached $1.99 billion, up 13.5% from a year earlier. Iron Mountain raised its full-year revenue outlook to $7.95 billion–$8.02 billion. That range is management guidance, not revenue already earned. Company earnings release filed with the SEC

Signed leases and commenced leases measure different things

The supplemental filing reports 102.492 megawatts of new and expansion leases signed in the quarter, versus 29.229 megawatts of leases that commenced. The Basis calculates that approximately 74.6% of year-to-date signed capacity was contracted in the third quarter, using 102.492 divided by 137.468. The commenced figure covers a separate set of leases; it is not a completion rate for this quarter’s signings. Supplemental information, page 21

Virginia projects show the delivery timetable

Iron Mountain lists two 14-megawatt phases at Northern Virginia’s VA-9 as fully preleased, with expected completion in the fourth quarter of 2026 and first quarter of 2027. Its 48-megawatt RCH-1 development in Richmond has expected completion in early 2028 and no preleased capacity shown in the table. These are company forecasts as of the reporting period. Development schedule, page 23

The Basis’s assessment: signed demand and delivered income should sit on separate lines in an underwriting model. A prelease helps establish a future customer, but the rent-start assumptions still need to match the construction schedule. Comparing projects also requires keeping a fully preleased phase separate from capacity being developed without a signed tenant. The quarterly leasing headline alone cannot establish either project’s timing or return.

Related: Lambda’s Alabama proposal and its remaining approval milestones.

Published by The Basis. Research dates, source references and illustrative assumptions are retained from the original article.