A DFW research brief for owners and buyers of garden-style communities.
A renovated apartment can be cheaper than a new community on the asking-rent sheet and more expensive after free rent. That is the comparison a DFW renovation budget needs to survive.
The research supports testing this risk locally. It does not establish that concessions have reduced renovation premiums across all older DFW properties. Public submarket averages cannot isolate the return on a particular renovation.
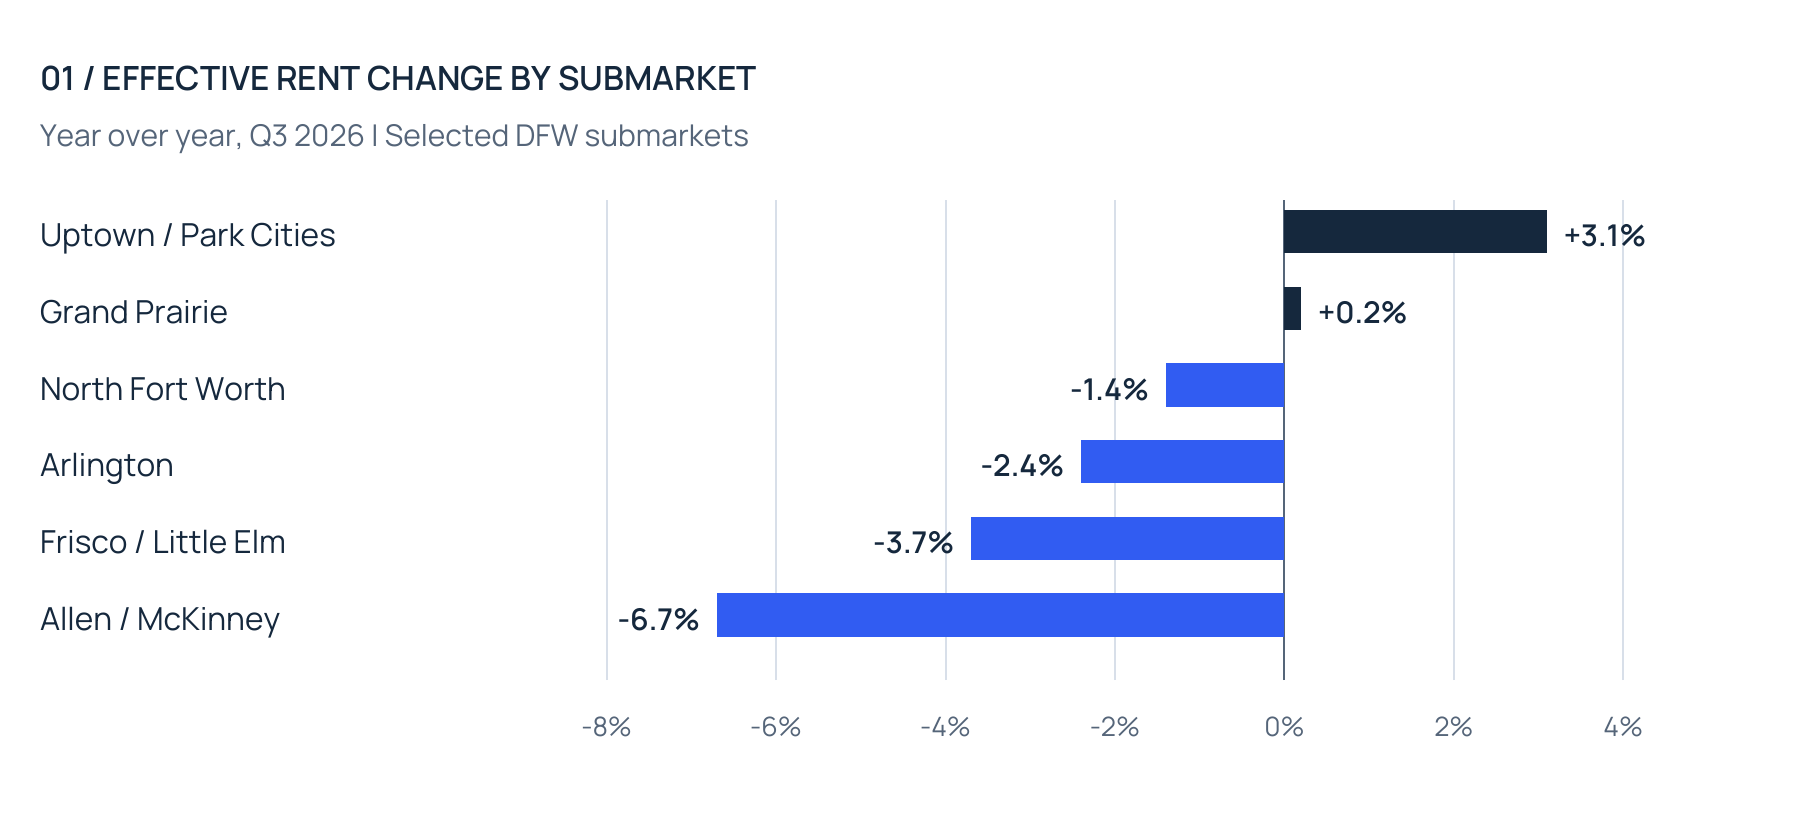
View chart data
| Submarket | Year-over-year effective rent change |
|---|---|
| Uptown / Park Cities | +3.1% |
| Grand Prairie | +0.2% |
| North Fort Worth | −1.4% |
| Arlington | −2.4% |
| Frisco / Little Elm | −3.7% |
| Allen / McKinney | −6.7% |
The pricing split is substantial. A rent-growth assumption suitable for Uptown/Park Cities would be difficult to defend in Allen/McKinney without direct leasing evidence. Our interpretation: use these figures to prioritize competitive checks, then establish the renovation premium from comparable units.
The renter’s alternatives
Price the upgrade against what residents can actually rent.
RealPage reported that Fort Worth’s concession usage fell 3.4 percentage points in September, yet it remained seventh among the 50 largest markets for usage. That is progress, with incentives still relevant. The measure covers stabilized units; it is not a lease-up-only survey. [2]
For a garden community, the useful comparison is between genuinely substitutable apartments: similar size, commute, lease term, and total mandatory charges. A nearby new building is a meaningful competitor only if it is an alternative your prospective residents would consider.
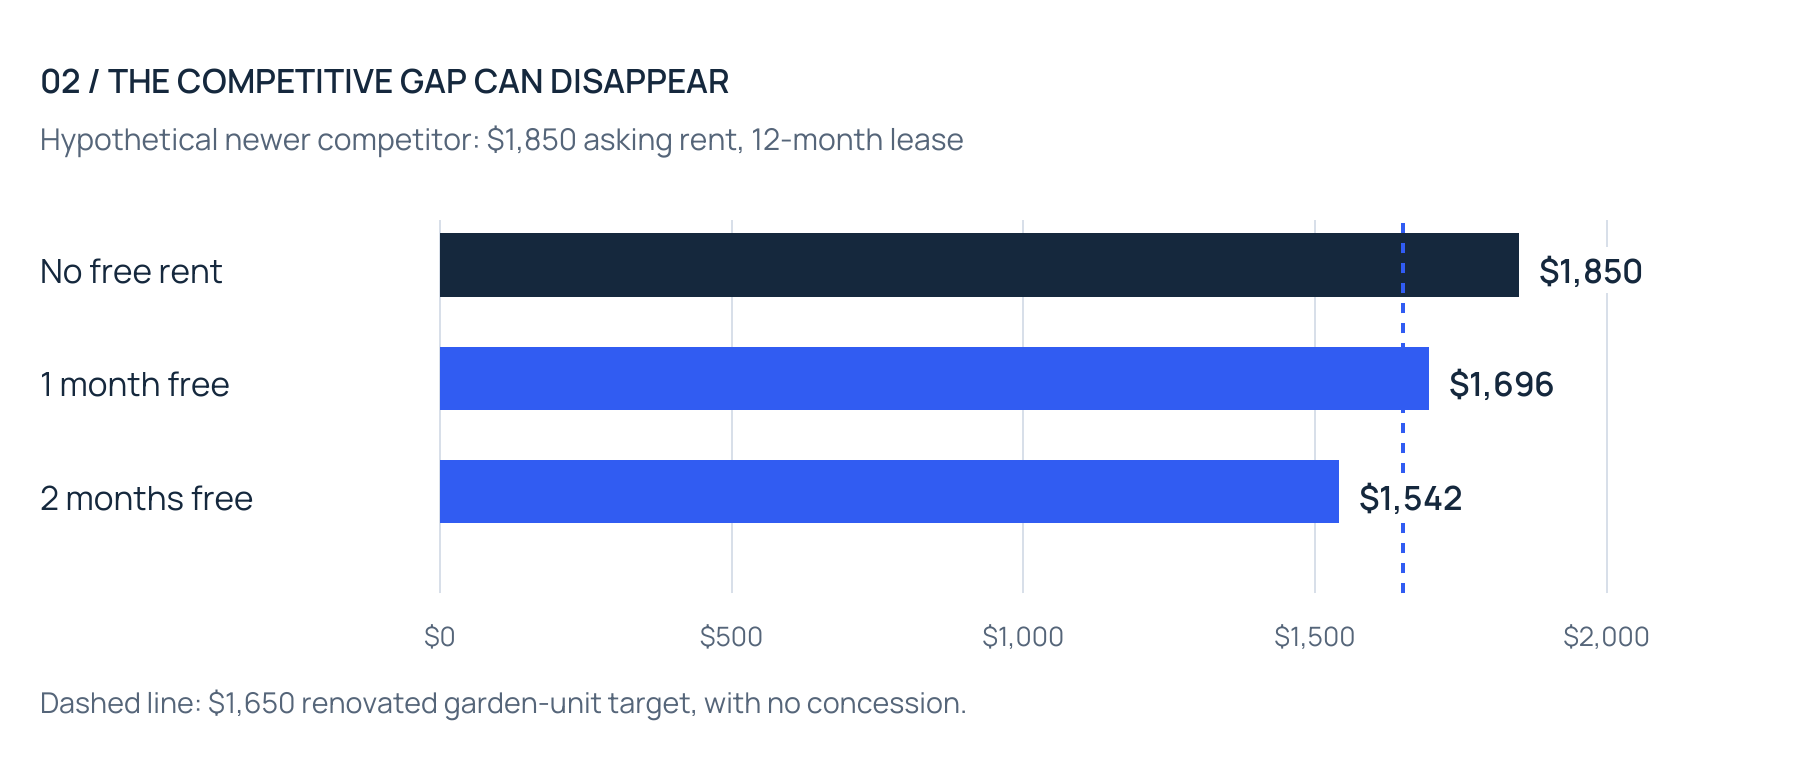
View chart data
| Concession | Effective monthly rent |
|---|---|
| None | $1,850 |
| 1 month free | $1,696 |
| 2 months free | $1,542 |
| Renovated garden-unit target, no concession | $1,650 |
At one month free, the newer apartment is only about $46 more per month than the renovated unit. At two months free, it is about $108 less. A planned upgrade may still win on layout, location, space, or service. Its price advantage, however, has narrowed or disappeared.
Free rent also has timing and eligibility conditions. A first-year effective-rent comparison should sit beside the resident’s actual monthly payments and potential renewal rent. It does not imply that two different apartments are equivalent.
The capital decision
Test the premium before you repeat the renovation.
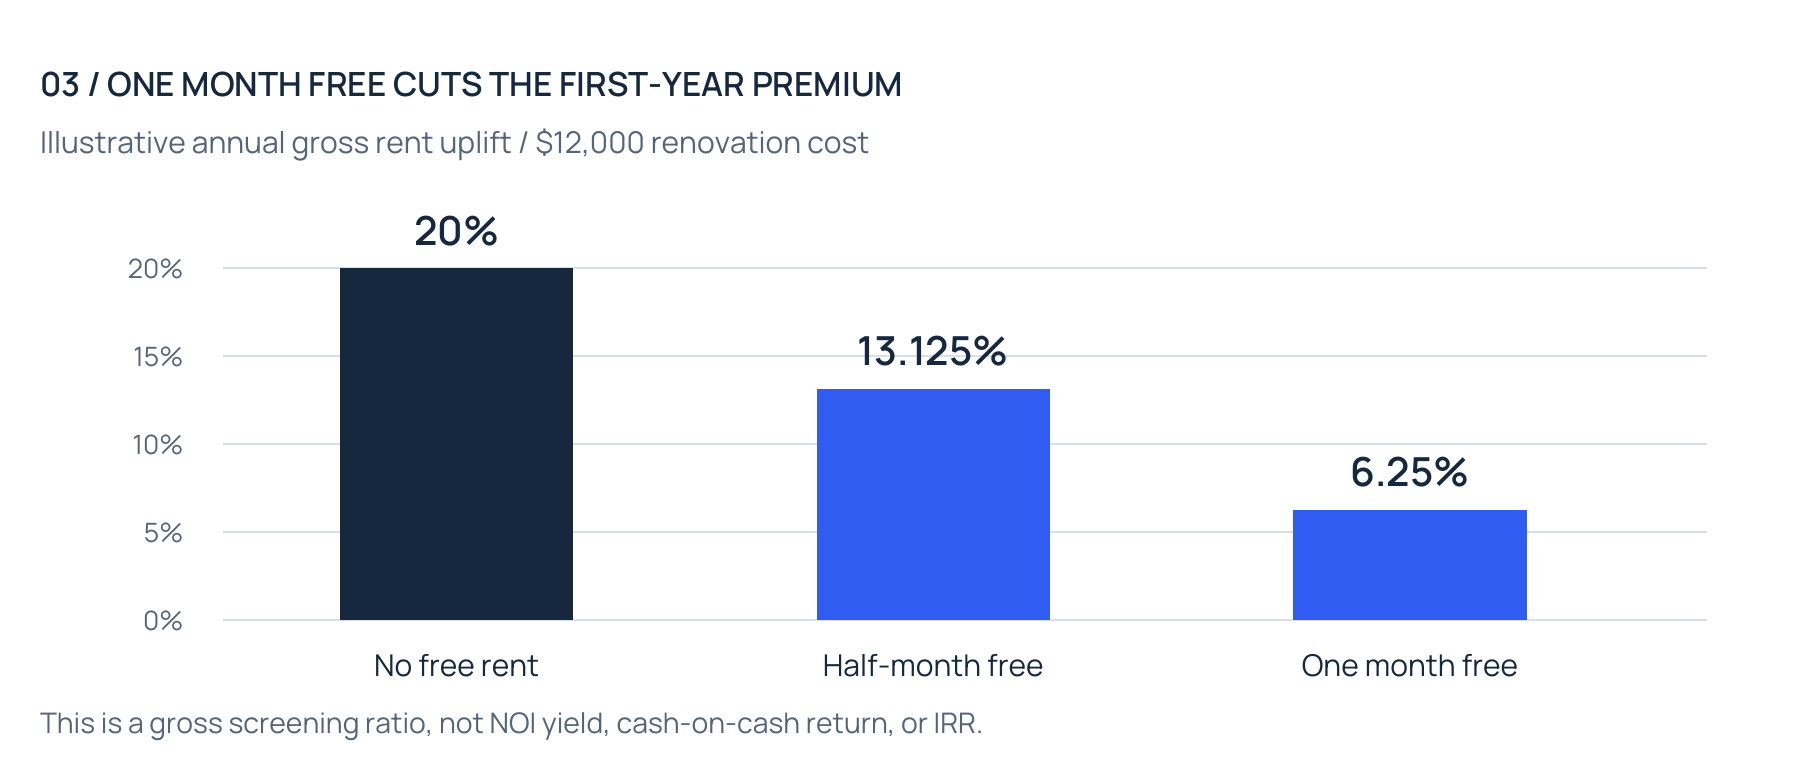
Assume an unrenovated unit can lease for $1,450 with no incentive. A $12,000 renovation targets $1,650. The apparent $200 monthly premium produces $2,400 of annual gross rent uplift. Now test incentives on the renovated lease while holding the baseline unchanged.
View chart data
| Renovated lease concession | Gross screening ratio |
|---|---|
| None | 20% |
| Half-month free | 13.125% |
| One month free | 6.25% |
| Renovated lease incentive | Effective monthly rent | Annual gross uplift |
|---|---|---|
| None | $1,650.00 | $2,400 |
| Half-month free | $1,581.25 | $1,575 |
| One month free | $1,512.50 | $750 |
One month free reduces the first-year gross uplift from $2,400 to $750. Turn downtime, additional operating costs, financing and collection losses would reduce the economic benefit further. If unrenovated units also need incentives, the comparison must change on both sides.
This is a screening calculation, not a lifetime return forecast. Future renewals may improve the outcome, but the underwriting must specify when and why. A small pilot of completed renovations can provide stronger evidence than applying the same assumed premium across an entire property.
From research to a decision
A selective renovation plan can still make sense.
The evidence is not uniformly negative. Northmarq reported Q2 2026 quarterly rent growth of 0.8% for Class B, versus 1.3% for Class A and a 0.6% decline for Class C. It also described increased investor interest that quarter in garden communities built in the 2000s and early 2010s. [3]
Those class categories do not identify renovation outcomes, and Q2 class trends should not be merged with Q3 submarket figures. They do challenge a blanket conclusion that older apartments cannot compete.
For an owner deciding where to spend, or a buyer underwriting an acquisition, we would require three pieces of property-level evidence:
An effective-rent comparison. Date-stamped offers and achieved leases for comparable floor plans, including incentives and mandatory fees. Keep renewal results separate from new leases.
A matched renovation test. Compare renovated and unrenovated units leased in similar periods. Account for size, floor, view, vacancy days and concessions before attributing a premium to the work.
A slower-recovery case. Model another leasing season of incentives. Fund the resulting cash need and test whether a narrower scope or phased schedule produces a better result.
Investment perspective
Underwriting before buyer introductions means identifying which improvements have demonstrated value and which remain assumptions. A seller can support pricing with actual leasing results; a buyer can avoid paying today for an unproven premium.
Sources & methods
[1] Cushman & Wakefield. DFW Multifamily MarketBeat, Q3 2026, pp. 2–3. Q3 2026.
[2] RealPage. Concession Use Slips in Three U.S. Regions as the Midwest Ticks Up. September 2026; published October 26, 2026.
[3] Northmarq. Dallas-Fort Worth multifamily quarterly demand nearly doubles new supply. Q2 2026; published September 30, 2026.
Research reviewed October 28, 2026. Publisher samples and boundaries differ. Public evidence establishes pricing variation and ongoing incentives, not a measured causal effect on garden-style renovation premiums. Examples are hypothetical and contain no private transaction data.
Bring us the rent premium behind your next move
Review the property’s income assumptions and how competing apartments affect the investment case.
Published by The Basis. Research dates, source references and illustrative assumptions are retained from the original article.